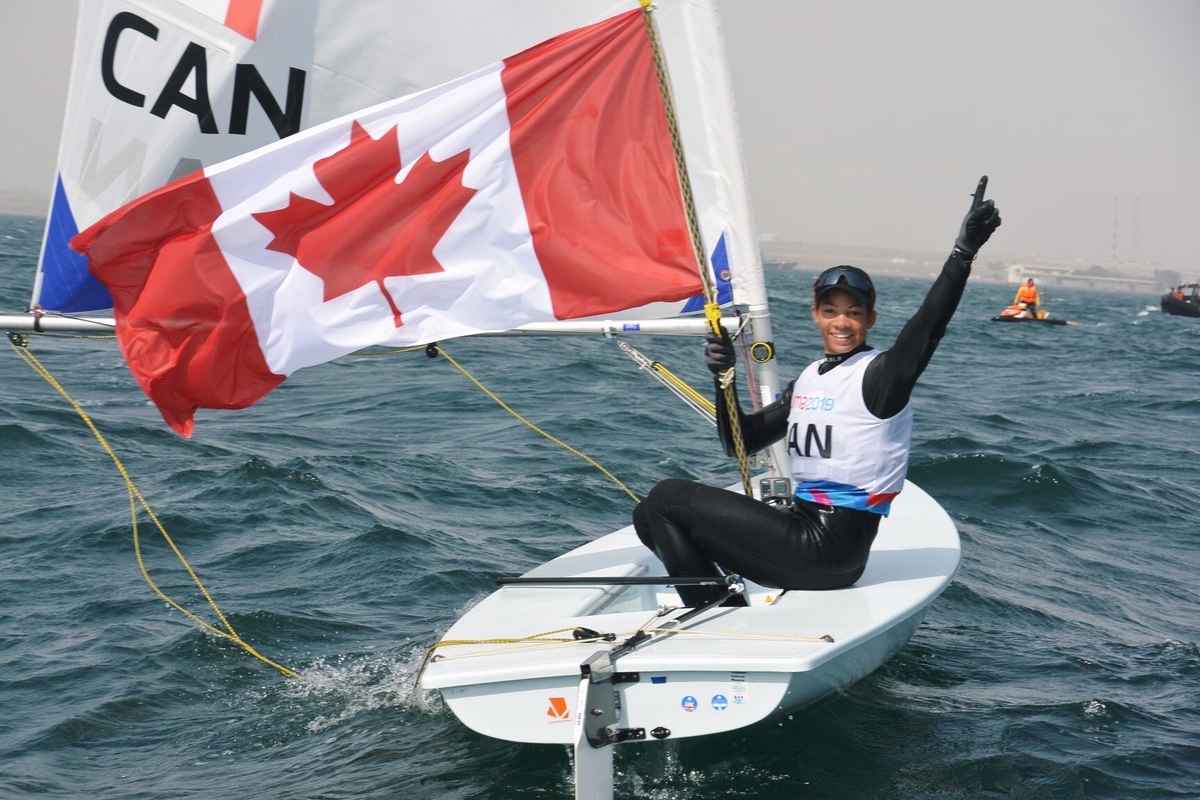
By Keith Norbury

Canada’s export and import trade with China crept up in 2012 again as a percentage of total trade, continuing a trend that goes back at least a decade. Exports to China totaled $19.31 billion in 2012, accounting for 4.25 per cent of Canada’s total exports of $454.55 billion, according to Industry Canada’s Trade Data Online. That vaulted China past the U.K. into second place on the list. “It’s not just one product that’s really driving that increase,” said Michael Burt, Director of the Conference Board of Canada’s industrial economic trends team and lead author of a December 2012 report titled Walking the Silk Road: Understanding Canada’s Changing Trade Patterns. “We are exporting a lot of different things to China.”

China had already been Canada’s second largest market for imports since the mid 2000s, Mr. Burt noted. That, combined with the surge in imports has almost quadrupled Canadian trade with China in just a decade, “a huge increase in a very short period of time,” Mr. Burt said.

The U.S., however, remained far out front as Canada’s leading trading partner in 2012. In fact, the proportion of Canadian exports that went to the U.S. actually rebounded slightly in 2012 after a decade of steady decline. Exports to the U.S. accounted for 74.6 per cent of Canada’s total, up from 73.7 per cent in 2011. In 2003, the U.S. accounted for 85.7 per cent of Canadian exports while China had just 1.3 per cent of that export share. “There’s essentially a new player that’s interposed between Canada and the U.S. and it’s really altering our trade relationship with the U.S.,” Mr. Burt said. That new player is, of course, China.

Trade imbalance levels off at $32 billion

China’s share of Canada’s overall imports grew to 11.0 per cent after having slipped to 10.8 per cent in 2011 from a high of 11.0 per cent in 2010. The value of imports from China to Canada, $50.7 billion in 2011, continued to far outstrip the value of Canadian exports to China. However, Canada’s trade imbalance with China was only a fraction higher at $31.87 billion in 2012 than it was in 2011 and 2010. Canada’s 2012 trade deficit with China was actually lower than the $32.16 billion trade imbalance in 2008. In that year, imports from China were worth nearly four times the value of exports to China.

“U.S. imports from China have surpassed its imports from Canada several years ago,” noted Dr. David Fung, Chairman and CEO of ACDEG Group of companies and a former senior fellow of the Asia Pacific Foundation of Canada. “However, the U.S. is not selling as much to China as it has been selling to Canada.”

What’s most important in Canada’s imports from China is the increasing level of industrial imports, such as machinery, as opposed to imports of consumer goods, Dr. Fung said. This equipment helps to make Canadian industries more competitive. “Capturing the competitiveness of China for our own benefit is where we need to go,” Dr. Fung said.

The implications of increased trade with China are pretty straight-forward for transportation industries, observed Dr. Paul Earl, the Acting Director of the Transportation Institute at the University of Manitoba. “Transportation is always a derived demand and it is derived from economic activity,” Dr. Earl said. “So the greater the level of economic activity, the greater the demand for transport services. And that begins to put pressure on infrastructure and on investment.”

Railway prepares for increasing demand

One potential challenge of meeting that demand would be rail capacity through the mountains to Canada’s West Coast, Dr. Earl noted. Canadian Pacific Railway, for example, is poised for continued growth in China trade, particularly when it comes to containerized cargo. CP, which recently installed a new management team led by former Canadian National Railway President Hunter Harrison, has reduced its long-haul transit times for intermodal freight, said company spokesperson Kevin Hrysak in an email message. “Chinese goods discharging at Port Metro Vancouver are now hitting key markets of Toronto and Chicago 24 hours earlier. The improved train times have sped up our assets and improved network fluidity, resulting in a more consistent, reliable product for our customers,” said Mr. Hrysak, who is CP’s media relations manager. CP is also optimizing its terminal infrastructure, such as expanding on-site storage of empty containers. That “reduces local dray moves, saving supply chain costs and reducing environmental impacts,” Mr. Hrysak said.

Both CN and CP have a presence in China. For example, CP opened a Beijing office in May 1997 and in 2002 partnered with the Chinese Railway Container Transport Company in a logistics company in Lanzhou, a city in Northwest China’s Gansu province. That partnership employs 40 people, Mr. Hrysak said.

At CN, no one was available to talk about its China business this year. However, last year Jean-Jacques Ruest, CN’s Executive Vice-President and Chief Marketing Officer, told Canadian Sailings that CN has five offices in China including Shanghai, Beijing, and Shenzen.

Chinese carrier reports growth in exports and imports

The majority of trade with China is through West Coast ports, in particular Port Metro Vancouver (PMV), the country’s largest trade portal. China-based ocean carrier COSCO (China Ocean Shipping Company) experienced growth in import and export volumes in 2012 compared with 2011 at Vancouver and Prince Rupert, said Dave Bedwell, COSCO Canada Inc.’s Executive Vice-President. There was also a “very modest increase” in January 2013 compared with January 2012, he added. At PMV, COSCO’s market share of container volumes, in and out, increased to 6.6 per cent in 2012, from a 5.8 per cent share in 2011, Mr. Bedwell said in an email. That moved COSCO to number 6 in PMV’s carrier rankings from seventh in 2011. In January 2013, COSCO had a 6.9 per cent share for fifth spot in those rankings.

In Prince Rupert, COSCO had a TEU market share of about 60 per cent and was also experiencing “rather robust growth” in January 2013, which Mr. Bedwell called a “pleasant surprise.” Despite that growth, however, Mr. Bedwell noted a “very unfortunate downside” to the global shipping industry: downward pressures on Transpacific rates East and West are pushing most ocean carriers into financial distress. That is also coinciding with increases in costs, such as Port Authorities requiring more funding for infrastructure; “pinched to capacity” stevedoring companies seeking “heavy increases on new contracts”; increasing intermodal costs charged by the railways; and high costs for fuel, pilotage, and tugs. Based on that, Mr. Bedwell predicts 2013 will “be another year of simple survival for most ocean carriers in the Transpacific.”

COSCO’s service strength is the China-North America corridor, he said. However, the company also provides “competitive container services to Japan, Korea, Vietnam, Thailand and Malaysian ports.” At present, COSCO operates two weekly services between China and Prince Rupert and Vancouver.

Prince Rupert holds key to Asian future

Prince Rupert presents Canada’ best hope for capitalizing on trade opportunities with China, Dr. Fung said. Building additional infrastructure in Vancouver, which is densely populated, causes resentment among residents who don’t like disruptions caused by construction, he pointed out. That was evident in the vocal opposition to new rail links and highways to serve the Vancouver region’s Deltaport, as well in opposition to proposals to build a new container terminal and to expand coal-handling capability.

Prince Rupert, by contrast, has a much smaller population that also welcomes the potential economic impact, Dr. Fung said. “That’s where I think the future expansion of Canadian port capability must reside,” he said.

Last November, Port of Prince Rupert’s Fairview Container Terminal, which opened in 2007, surpassed its design capacity of 500,000 TEUs. A fourth crane is expected this year that will increase its capacity further, said Michael Gurney, Communications Manager for Prince Rupert Port Authority. In the long run, the plan is to expand the container terminal so that it can handle two million TEUs annually. However, that plan is still awaiting an investment decision, Mr. Gurney said. Construction did begin in March on a $90 million road, rail and utility corridor project at Prince Rupert that will serve proposed potash and liquified natural gas terminals on Ridley Island. “This project will connect Canada’s proven capacity for resource production to growing markets in the Asia-Pacific region and is the largest in Prince Rupert since construction of the Fairview Container Terminal,” said Bud Smith, Chairman of the Board of Prince Rupert Port Authority, in a news release announcing the start of the corridor project.

Canpotex Limited, a consortium of Canada’s major potash producers, received federal environmental approval in November to build a Prince Rupert potash terminal. However, a spokesperson for one of the partner companies said a decision had yet to be made on when to proceed on the project. “We’re not making that decision specifically in light of China,” said Denita Stan, Vice-President of Investor and Public Relations for Potash Corp.

Canadian potash exports to China actually dropped off in 2012 to $366 million compared with $503 million in 2011, according to Trade Data Online. But overall Canadian potash exports also dipped from a peak of $6.7 billion in 2011 to $6.01 billion in 2012. Potash exports to China have been on even more of a roller coaster ride in recent years than the export totals. In 2009, they dropped to $121 million from $535 million in 2008, for example. In 2012, China accounted for 6.0 per cent of Canada’s potash exports compared with 15.7 per cent in 2005. However, total overall 2005 potash exports of $2.77 billion were less than half the value of the 2012 overall exports. Ms. Stan sounded optimistic about the future for potash exports. “If our thesis is right and demand for potash continues to grow at a really good clip, I’ll think we’ll need options for shipping this stuff as we go forward,” she said.

Chinese demand boost lumber fortunes

China has also become a bigger market for Canadian lumber exports. That boost has coincided with a flat U.S. market for exports because of persistent low U.S. housing starts in the wake of the 2008 financial meltdown. “We’ve always exported (lumber) to Japan and to some extent China, but now China has picked up some of that slack. It’s happened as a result of the fact that there’s demand in China and there hasn’t been that much demand in the U.S.,” said Hugh Stephens, principal of Trans-Pacific Connections Consulting in Victoria, B.C., and Executive in residence with the Asia Pacific Foundation of Canada.

That’s certainly the case at Port of Nanaimo, where about 90 per cent of lumber exports are now destined for China, said Doug Peterson, the Port’s Manager of Marketing and Sales. In 2012, the port exported about 125 million board feet of lumber. That compared with about 115 million board feet the previous year, and only 10 million board feet in 2009. “It’s only been in the last couple of years that China has come into its own,” Mr. Peterson said.

The Conference Board’s Mr. Burt, however, expects demand for B.C. lumber in China to slow down in the coming years. Allowable cuts in the province’s interior are expected to plummet as a response to the destruction wreaked by the infestation of mountain pine beetles that ravaged those forests. (That should not harm Nanaimo’s business, though, because Nanaimo exports mainly hemlock from Vancouver Island forests).

Most Canadian lumber exports to China are used in concrete forming for building urban housing and industrial infrastructure. While migration from rural areas to urban centres is continuing in China, Mr. Burt said, “the buildup of industrial capacity in China is slowing down.”

As Chinese economy shifts, so will demand for imports

Wood products are also a counter-intuitive example of shifts in what Canada is now importing from China, Mr. Burt pointed out. “Fifteen years ago people might have been buying maple hardwood flooring products made in Canada. But today Chinese consumers are buying bamboo products or they’re buying something made with a more exotic hardwood coming from Southeast Asia that was manufactured in China,” Mr. Burt said.

That’s just one small example of how Canada’s trade with China has changed in recent years. Canadian trade with the U.S. has been stagnant so far this century but has almost doubled with other countries in the last decade, Mr. Burt said.

Back in 1997, Canada’s trade with China was much smaller than it is today, according to Statistics Canada. In 1997, Canada imported only $6.3 billion worth of Chinese goods and exported $2.4 billion for a trade deficit with China of $3.9 billion. Since then, the value of imports and exports has grown every year except for 2008, when imports dropped even as exports continued to rise. “I do think we are starting to approach the limits of growth in China, at least in terms of the signals that the government is sending,” said Mr. Stephens, who lived and worked for 12 years in Asia as a Canadian diplomat and another decade as an Executive with Time Warner. “It’s been growth at all cost.”

Many Chinese, particularly those who now have a degree of affluence, are getting fed up with unpleasant consequences of that growth, such as dirty air in Beijing that isn’t fit to breathe, he said. That is putting pressure on the Chinese government to improve the quality of life. Mr. Stephens expects to see more emphasis in China’s next few five-year economic plans on weaning its economy off coal and placing greater emphasis on renewable energy. “It takes a long time. It’s a very big place,” Mr. Stephens said. “You don’t turn it around overnight.”

Wheat no longer king of exports to China

The makeup of Canada’s trade with China has changed considerably in the last 15 years. In 1997, wheat was Canada’s major export to China, accounting for 18.9 per cent of export values. By 2006, wheat had dropped out of the top 10 export categories. Leading the list that year was wood pulp, at 14.8 per cent. Wood pulp had been in third place, with 10.9 per cent, in 1997. Organic chemicals, nickel articles, and metals ores also increased in significance in 2006 compared with 1997. Electrical machinery and equipment and fertilizers meanwhile declined as a percentage of total exports, although the value of electrical machinery and equipment exported actually increased.

On the import side, the category “electronics, sound equipment etc.” topped the list at 14.9 per cent, with toys close behind at 13.7 per cent in 1997. By 2006, the category “machinery, reactors, boilers” was on top, with 20.8 per cent of import values. In 1997, that category had ranked fourth at 8.7 per cent. While “electronics, sound equipment etc.” had fallen to second position in 2006, its percentage of total exports increased to 19.7 per cent. The share of other categories, such as “toys, games and sports equipment,” also fell in that period, although their actual dollar values grew substantially in most cases. For example, “footwear etc.” accounted for 8.8 per cent of imports from China in 1997. But that $558.5 million worth of product was less than half the value of the $1.13 billion imported in 2006 when the category made up just 3.3 per cent of imports.

Computers and cellphones in, ores and wood pulp out

Industry Canada’s Trade Data Online provides any number of detailed reports on what products are imported from and exported to Canada. For example, at the six-digit HS code level, the most popular import from China in recent years is HS847130, which is described as “portable automatic processing machines, weighing less than 10 kilograms, with CPU, keyboard, and display.” Those sound like personal computers. They made up 7.62 per cent of imports from China to Canada in 2012, about the same level as in the previous two years. Second on that list for 2012 was cellphones (or HS851762 — “telephones for cellular networks or for other wireless networks”). Cellphone values totaled 6.87 per cent in 2012. In 2006 and earlier, they didn’t even rate a classification, another sign of how trade patterns can change quickly.

On the export side, HS26 (ores, slags and ash) accounted for 14.2 per cent of Canada’s $19.3 billion in total exports to China in 2012. Second on the list was HS47, which included wood pulp, at 13.7 per cent. And third was HS12, which included oil seeds, at 12.6 per cent. At fourth spot on the 2012 export list to China was HS27, which included mineral fuels and mineral oils.

“China has a huge industry making plastic products of one sort or another, but its natural resource base is limited,” Mr. Burt said. “So you’re seeing resins made from Canadian petroleum products being exported to make plastic products in China.”

That’s certainly reflected in the commodities that Canadian Pacific carries for export to China. They include wood, wood pulp, scrap paper, plastics, machinery and equipment, canola, oil seeds, wheat, ores, slag, ash, coal, nickel, sulphur and potash, Mr. Hrysak said.

Resource commodities, such as agricultural and forest products as well as petrochemicals, make up the bulk of COSCO’s cargoes to China, Mr. Bedwell said. “Luckily Canada has a rather abundant supply of what this country’s trading partners require,” Mr. Bedwell said. “Both our federal and local governments have done a superb job of marketing Canada’s resources to the rest of the world.”

China-U.S. trade also rapidly increasing

At the same time as trade between Canada and China has been increasing, so has trade between China and the U.S. In fact, China-U.S. trade was very close to surpassing Canada-U.S. trade in 2011 as the world’s largest bilateral trading partnership. U.S. trade with China in 2012 tallied US$110.59 billion in exports and US$425.64 billion in imports, for a total of US$536.23 billion, and resulting in a U.S. trade deficit of $315.05 billion, according to the U.S. Census Bureau. The comparable figures for Canada-U.S. trade were exports to Canada of US$292.44 billion and imports of US$324.25 billion, for a total of US $616.69 billion, and a Canadian trade deficit of US$31.80 billion. (Stats Canada figures for 2012 were C$339.099 billion for U.S. imports from Canada, and C$233.750 for exports to Canada, for a total of C$572.849 billion.)

“But the pace of growth in trade volumes between the U.S. and China is probably going to slow down,” Mr. Burt said. “I don’t think we’re going to see the same growth in the next decade that we saw in the previous decade.” That’s in large part because China’s entry into the global economy in 2001, when it became a member of the World Trade Organization, was a one-time shock, he said. “There are also issues with labour costs in China,” Mr. Burt said. “Ten years ago, labour costs in China were a lot lower than they were in the United States. That’s a lot less true today, just because wages have been rising so much in China.” Also of significance is the changing nature of Chinese manufacturing, Mr. Stephens said. He said that Chinese manufacturing is moving up the ladder, from contract manufacturing and a low-cost assembly operations, Chinese manufacturing is increasingly moving toward designing and marketing its own products. That’s because of rising costs as well as a maturing economy, he noted. One interesting recent trend is that of some manufacturing being repatriated to North America from Asia. (Both Apple Computer and General Electric announced last year that they would repatriate some manufacturing to the U.S.) That’s because productivity gains in North America offset the advantage of lower wages in China, Mr. Stephens pointed out. “And then you see other low-cost manufacturing moving further downstream to Southeast Asia, Laos, Cambodia, Vietnam, etc.,” he said.

That doesn’t mean outsourcing is dead, he observed. “It just looks like it is now turning into more of a two-way street,” Mr. Burt said. “Some activity will be coming back to North America. Some of it may still be going to China.”

Be equipped for increasing trade

Looking ahead, Mr. Bedwell, said that “with luck”, robust trade between Canada and China should continue. But he also sees more manufacturing shifting to Vietnam and India. “So we will have to watch that trend closely in the future and adapt as necessary to any swings in cargo origin,” Mr. Bedwell said. On the export side, he expects percentage growth to be in the single digits but cautioned that he is already noticing containerized forest products making their way into a revitalized U.S. market “where Canadian forest product companies are getting a bigger bang for (the) buck.” Also, regardless of the growth in exports, he said, “if ocean carriers do not have the import container loads arriving to match up with the export demand, then our Canadian shippers will run into equipment shortages.”